electricpy.visu.SeriesRLC
- class electricpy.visu.SeriesRLC(resistance: float, inductance: float, capacitance: float, frequency: float)[source]
Frequency Response for an RLC (Resistive, Inductive, Capacitive) Load.
Generate unique information about an RLC circuit. Using this class, you may generate a variety of useful statistics including resonance frequency, bandwidth, lower and upper cuttoff frequencies, and more. Each of the specific parameters are evaluated as follows.
Resonance Frequency:
\[\text{resonance_frequency} = \frac{1}{\sqrt{L * C} \cdot 2 \pi}\]Bandwidth:
\[\text{bandwidth} = \frac{R}{L \cdot 2 \pi}\]Quality Factor:
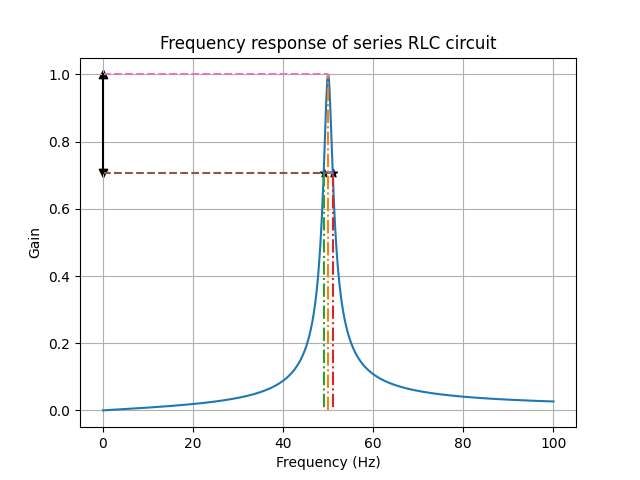
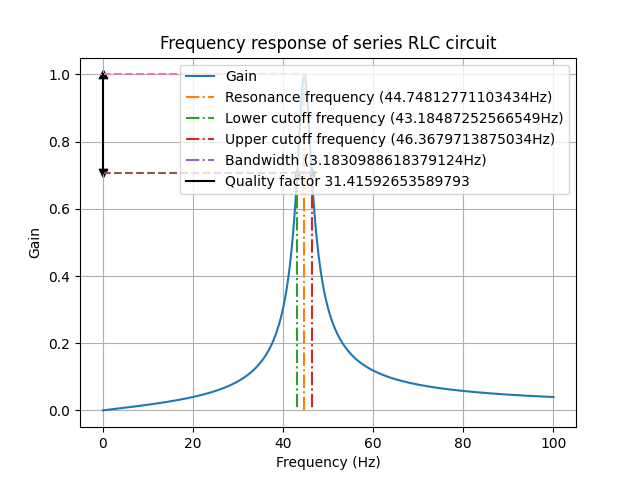
\[\text{quality_factor} = 2\pi \frac{\text{freq}}{R}\]Given the characteristics listed below, and the Python code described in the associated example, the following plot will be generated.
Resistance: 5 ohms
Inductance: 0.4 henreys
Capacitance: 25.3e-6 farads
Frequency: 50 Hz
Resistance: 10 ohms
Inductance: 0.5 henreys
Capacitance: 25.3e-6 farads
Frequency: 50 Hz
Examples
>>> from electricpy.visu import SeriesRLC >>> rlc_component = SeriesRLC( ... resistance=5, inductance=0.4, capacitance=25.3e-6, frequency=50 ... ) >>> rlc_component.resonance_frequency 50.029927713857425 >>> rlc_component.bandwidth 1.9894367886486917 >>> plot_1 = rlc_component.graph( ... lower_frequency_cut=0.1, upper_frequency_cut=100, samples=1000 ... ) >>> plot_1.show() >>> plot_2 = SeriesRLC( ... resistance=10, inductance=0.5, capacitance=25.3e-6, frequency=50 ... ).graph( ... lower_frequency_cut=0.1, upper_frequency_cut=100, samples=1000, ... show_legend=True, ... ) >>> plot_2.show()- Parameters:
- __init__(resistance: float, inductance: float, capacitance: float, frequency: float)[source]
Form the Frequency Response Analysis System.
Methods
__init__(resistance, inductance, ...)Form the Frequency Response Analysis System.
graph(lower_frequency_cut, upper_frequency_cut)Generate a Plot to Represent all Data Respective of the RLC Circuit.
legend()Generate a Legend for the Graph.
output_gain(frequency)Evaluate Output Gain of Described RLC Circuit at a Particular Frequency.
Attributes
bandwidthBandwidth of the Described RLC Circuit.
lower_cutoff_frequencyLower Cutoff Frequency (in Hz) of the Described RLC Circuit.
quality_factorQuality Factor of the Described RLC Circuit.
resonance_frequencyResonance Frequency (in Hz) of the Described RLC Circuit.
upper_cutoff_frequencyUpper Cutoff Frequency (in Hz) of the Described RLC Circuit.