electricpy.visu.convbar
-
electricpy.visu.convbar(h, x, outline=
True)[source]¶ Convolution Bar-Graph Plotter Function.
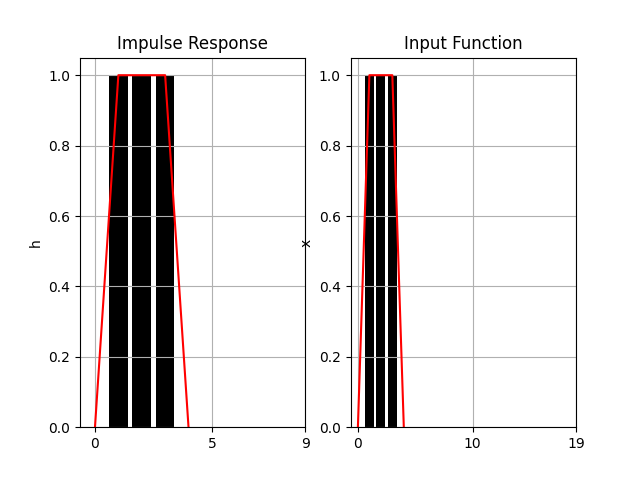
Generates plots of each of two input arrays as bar-graphs, then generates a convolved bar-graph of the two inputs to demonstrate and illustrate convolution, typically for an educational purpose.
Examples
>>> import numpy as np
>>> import electricpy.visu as visu
>>> h = np.array([0, 1, 1, 1, 0])
>>> x = np.array([0, 1, 1, 1, 0])
>>> visu.convbar(h, x)