electricpy.visu.phasorplot
-
electricpy.visu.phasorplot(phasors, title=
'Phasor Diagram', legend=False, bg=None, colors=None, radius=None, linewidth=None, size=None, label=False, labels=False, tolerance=None)[source]¶ Phasor Plotting Function.
This function is designed to plot a phasor-diagram with angles in degrees for up to 12 phasor sets (more may be used if additional colors are set). Phasors must be passed as a complex number set, (e.g. [ m+ja, m+ja, m+ja, … , m+ja ] ).
Examples
>>> import numpy as np
>>> from electricpy import phasors
>>> from electricpy import visu
>>> voltages = np.array([
...     [67,0],
...     [45,-120],
...     [52,120]
... ])
>>> phasors = phasors.phasorlist(voltages)
>>> plt = visu.phasorplot(phasors, colors=["red", "green", "blue"])
>>> plt.show()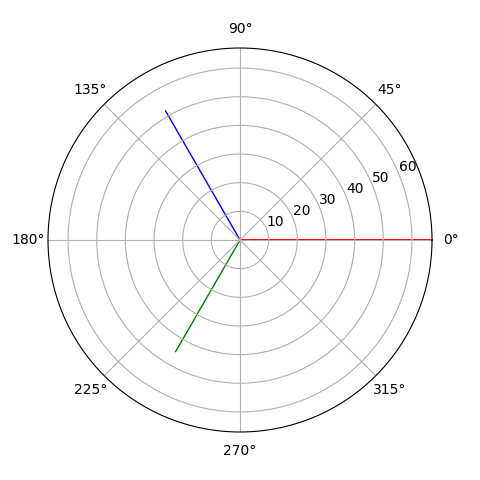
- Parameters:
- phasors : list of complex
The set of phasors to be plotted.
- title : string, optional
The Plot Title, default=”Phasor Diagram”
- legend : bool, optional
Control argument to enable displaying the legend, must be passed as an array or list of strings. label and labels are mimic- arguments and will perform similar operation, default=False
- bg : string, optional
Background-Color control, default=”#d5de9c”
- radius : float, optional
The diagram radius, unless specified, automatically scales
- colors : list of str, optional
List of hexidecimal color strings denoting the line colors to use.
- size : float, optional
Control argument for figure size. default=None
- linewidth : float, optional
Control argument to declare the line thickness. default=None
- tolerance : float, optional
Minimum magnitude to plot, anything less than tolerance will be plotted as a single point at the origin, by default, the tolerance is scaled to be 1/25-th the maximum radius. To disable the tolerance, simply provide either False or -1.
- Returns:
matplotlib.pyplot – or plotting.
- Return type:
Plotting object to be used for additional configuration